Search Options Trading Mastery:
- Home
- Stock Option Trading
- Stock Options Implied Volatility
Stock Options Implied Volatility
What You Should Know About Stock Options Implied Volatility
Stock options implied volatility is one of those terms you so often hear, but understanding its significance can be critical to a successful trading outcome. In fact, some traders believe in it so much that they are known as "volatility traders".
Directional trading (predicting the future direction of the underlying asset) is difficult enough as it is, so anything that allows you to stack the odds in your favor has got to be worth investigating. Factoring implied volatility into your trading decisions achieves just that.
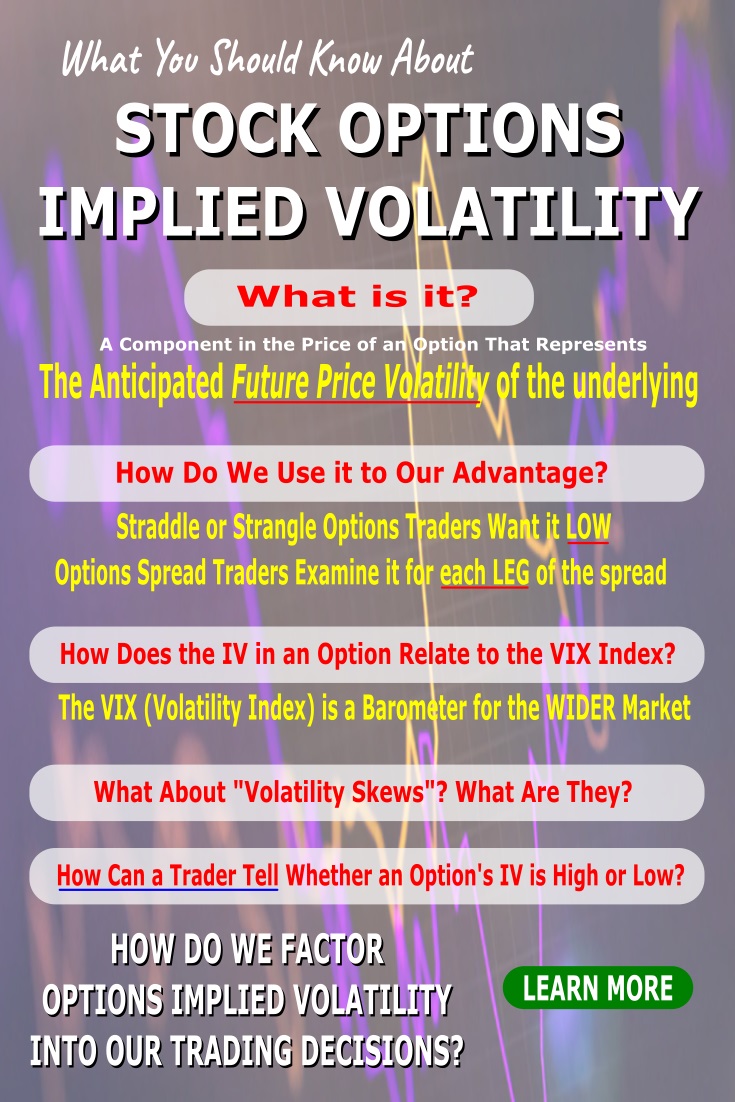
Stock options implied volatility (IV) is a number which expresses the anticipated future price volatility of the underlying financial asset in terms of the current market price of the option.
If the IV, expressed as a percentage, is high, then this theoretically reflects a large anticipated average price change in the underlying within the time frame covered by the number of days to option expiration date.
If it is low, then it implies that the underlying asset (e.g. company stock) price is not expected to move much in the future - theoretically.
The implied volatility is calculated using option pricing models. These give a theoretical value of an option contract based on the current market price of the underlying relative to the option strike price and remaining time to expiration.
But since options markets have their own supply and demand, market forces come into play and create inflated or deflated options prices due to interest in the options or lack thereof.
For example, during times of uncertainty when the market is expected to dive, put options are high in demand as investors rush to hedge their positions, which in turn drives their prices up.
But this is not always the case - and herein lies opportunities for the trader.
Using Stock Options Implied Volatility to Your Advantage
Here are a number of ways that traders, using varying trading strategies, can take advantage of Implied Volatility.
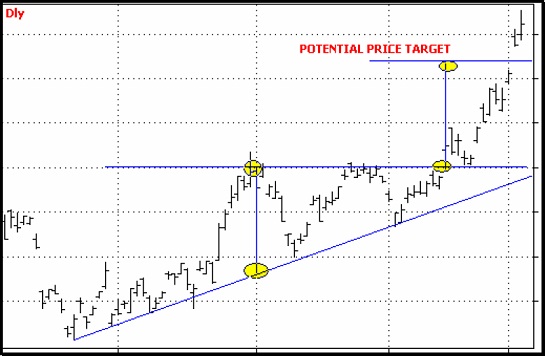
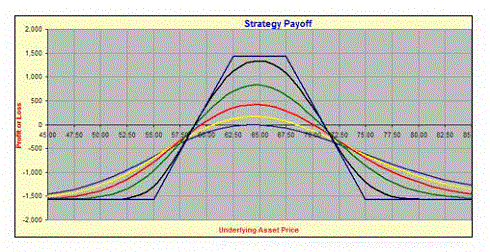
1. Straddle or strangle traders should look for low option IV when entering straddle positions. This quite common near the end of chart triangle patterns, which often precede a price breakout.
Low IV means the options will be cheap, but once the price action begins to explode, the IV of either calls or puts should increase due to popular demand.
The inflated options prices on one side will more than pay for the losing options (bought cheaply) on the other side and yield a profit.
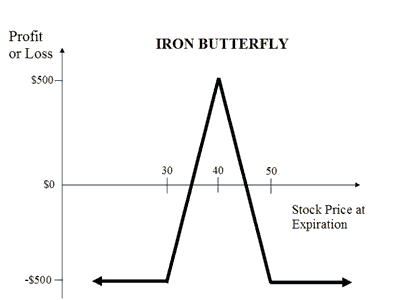
2. Option spread traders should consider IV when looking at each leg of their positions. If you're executing a credit spread or an iron condor, it is desirable to sell the short options with a higher IV than the further out-of-the-money options you will buy.
Alternatively, a debit spread trader should look for the reverse, because in the event of the stock price going against you, it will provide a buffer before your stop loss is hit.
3. The Victory Spreads strategy comes alive when finding securities where there is an implied volatility skew. When you find them, these types of trades are "set and forget" positions where it's almost impossible to lose.
4. Calendar Spread traders should ensure that the IV in the back month is not more than 2 percent greater than the IV in the front month options that you're going to sell.
Stock Options Implied Volatility and the $VIX
If you're trading stocks and options on US markets, you should always be aware of the $VIX or Volatility Index. It should not be confused with the implied volatility in option prices though, but is nevertheless very useful. It works in a way that is opposite to the Dow Jones Index, in that it goes up when the Dow is going down, and vice versa.
The reason for this is, that the $VIX measures the overall market ratio of put options that are being traded, in contrast to call options. Since the market buys more puts to hedge positions when prices are falling, the $VIX will rise accordingly.
The Volatility Index can be used as a barometer for future overall market direction. When it reaches extreme levels or strong resistance points, it indicates the US market price action may be due for a reversal.
Volatility Skews
Volatility Skews occur when there is an unusual IV difference between at-the-money, out-of-the-money and in-the-money options prices for the same security.
Some options prices become unusually affected when demand for them is greater than for their counterparts at different strike prices. Consequently, they become over-priced and this creates the volatility skew.
When this occurs, it can present opportunities for option spread traders or those wishing to use short positions.
Stock Options Implied Volatility - How to Tell When it is High or Low
It's easy to say that the IV in an option price is "high" or "low" but how do you know this? One obvious way, is to compare it with other option IV's for different strike prices or expiration months.
Another way, is to know what the historical volatility (HV) for the underlying security (not the options) is and compare it with that. Most online broker websites should be able to provide this information. It is the average price movement of a stock over a given period of time, expressed as a percentage.
If your options strategy is to simply go long calls or puts, you should look to see whether the IV in the options prices you're thinking of buying is the same or lower than the HV for the stock.
If not, then your options may be over-priced and in the event of a move in your favor, may not realize the profit levels you were hoping for. Sometimes the underlying security can move as you expected but if you've bought over-priced options, you don't make any money.
When working out your trading plan, don't forget the advantages of stock options implied volatility!
**************** ****************
Return to Stock Option Trading Contents Page
Go to Option Trading Homepage




New! Comments
Have your say about what you just read! Leave me a comment in the box below.