Search Options Trading Mastery:
- Home
- Option Spread Trading
- Put Ratio Backspread
Put Ratio Backspread Option Strategy
The put ratio backspread is an option spread trading setup that falls into the class of strategies designed to take advantage of upcoming price volatility.
Being a backspread, it profits from price breakouts. The risk of loss on the trade occurs when the price action of the underlying remains within a consolidation pattern, or returns to the loss zone as option expiration approaches.
Put ratio backspreads are also credit spreads, but unlike your regular credit spread where your profit potential is limited to the credit you receive, these backspreads have unlimited profit potential. So you get all the benefits of other backspread strategies such as the straddle, but you receive a credit instead of paying a debit for it.
Being a put spread, this strategy does have a directional bias though - you're looking for a price breakout to the downside. However, if you construct them correctly, you can even make a small profit should the price break to the upside. If you want to take a bet both ways, so to speak, you can combine this strategy with a Call Ratio Backspread for unlimited profit to the upside as well.
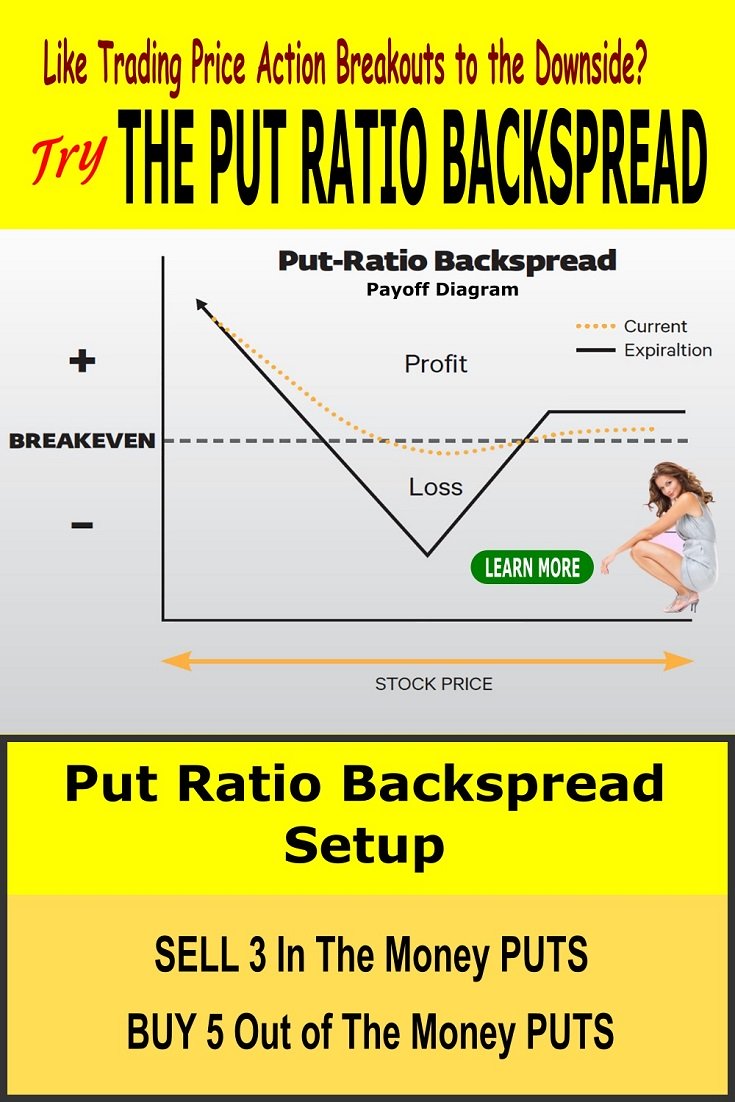
| Put Ratio Backspread Setup |
| Sell
3 ITM Puts Buy 5 OTM Puts |
The above is only one example of how a put ratio backspread may look. By experimenting with different combinations of short and long positions and examining the risk graph, you can come up with one that suits your objectives.
The important thing is, that you buy more out of the money (OTM) puts than the ITM ones you sell - this is the ratio part.
Since the ITM options you sell will be more expensive than the OTM options that you purchase, providing the ratio is not too extreme, you should receive a net credit. As the price of the underlying falls, the ITM options will have a higher option delta than the OTM options and for a little while, increase in value at a higher rate.
But once the OTM option strike prices have been breached so that they become in the money, the profit margin on these will outclass the sold options - and because there are more of them, you realize an overall profit.
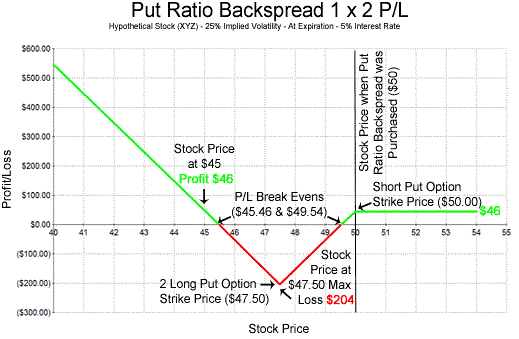
Here's what a typical put ratio backspread looks like on a payoff diagram:

The risk graph above assumes a ratio of 1 ITM options sold, to 2 OTM options bought.
- The ITM short option strike price is $50
- The OTM long option strike price is $47.50
You'll see that, should the price of the underlying sail north, you still realize a small profit. If it remains within a range, you lose on the trade at expiration. But if it falls past the $45.46 breakeven point, your profit potential to the downside is almost unlimited.
However, if you had chosen to widen your short and long strike prices, the risk graph would reflect that. The closer your strike prices, the greater your potential profit to the downside, but you make less on the upside.
Best Time to Use a Put Ratio Backspread
Since you're relying on price volatility, you should choose an asset that you expect to drop sharply in the short term. This may be due to a news event, an upcoming earnings report, or technical indicators such as price consolidation in an overbought price range.
If you're trading index related ETFs, it could be at the beginning of an overall pessimistic mood in the market which could be related to some political event or economic conditions.
The benefit of the put ratio backspread over buying simple put option positions is, that should your prognosis be wrong and the price of the underlying goes in the opposite direction to what you anticipate, you can still make some profit. It does however, make less profit than a simple long put option would for the same downwards price movement in the underlying.
**************** ****************
Return to Option Spread Trading Contents Page
Go to Option Trading Homepage


New! Comments
Have your say about what you just read! Leave me a comment in the box below.