Search Options Trading Mastery:
- Home
- Option Trading Systems
- Option Swing Trading
Option Swing Trading
Option Swing Trading - A Safe and Highly Profitable Trading Strategy
Option Swing Trading focusses on using one of the oldest and most popular trading methods for trading the markets. It was popularized by the legendary W.D. Gann in the early 20th century, who made millions on the stock market after defining his own unique set of rules and applying them to futures contracts.
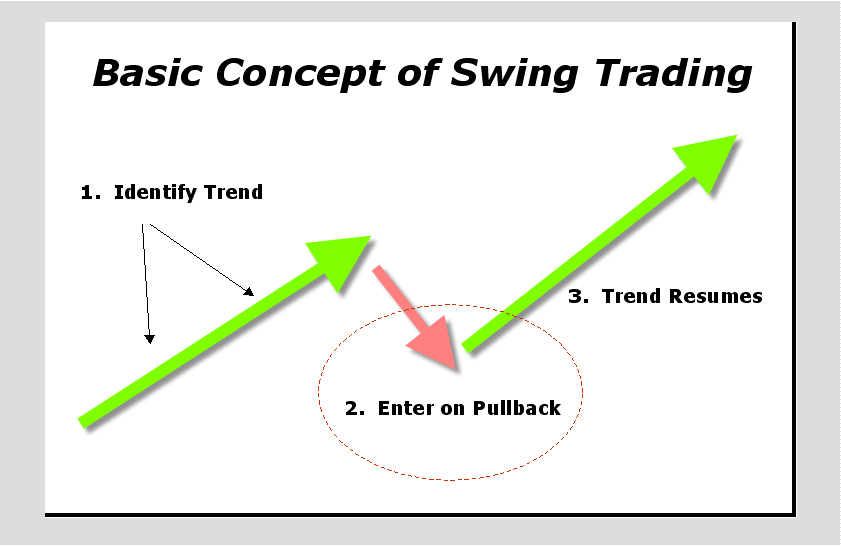
Many books have since been written about this technique, each containing variations of the one overriding theme - identify a trend, wait for the pullback and hop on for the ride when the trend resumes. To do this, you need to understand price charts and technical analysis.
Option Swing Trading takes advantage of short term moves in share prices and uses the leverage available in options to create an income stream with much less capital than would be needed if you were buying and selling the shares themselves.
Options also give you the ability to make money whether the move is upwards or downwards. You simply use call options for an upward swing and put options for a downward swing. If you were trading stocks you would have to short sell the stock for a down swing and take on margin risk.
Option Swing Trading can be applied in either of two ways:
(1) Using Chart Patterns.
(2) Trend Trading - identify trends and enter on the pullbacks.
Price Chart Patterns
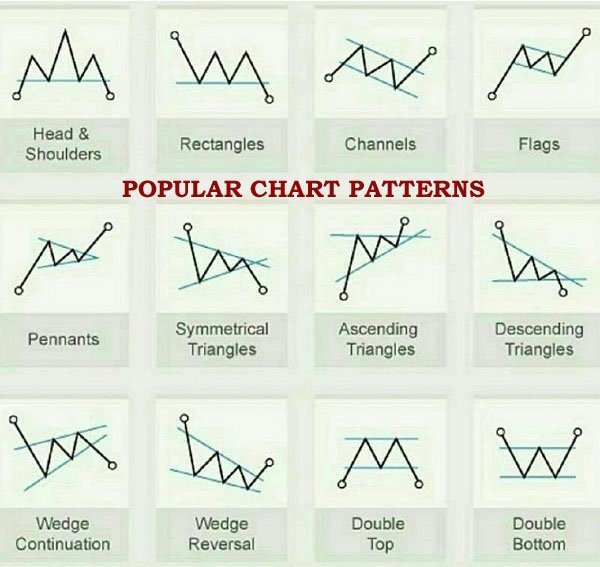
Let's take a look at identifying chart patterns. There are a number of well-known price chart patterns which help traders to anticipate potential entry and exit targets. These include the channel, rising and falling wedges, triangle patterns, head and shoulder patterns, double tops and bottoms, flags and pennants.
These are best recognized by drawing lines over the price action. The trader then waits for confirmation and preferably one that includes a confluence of more than one signal.
For example, it might be a candlestick reversal pattern at the top or bottom of a channel pattern, or it might be after the price consolidates a little and then breaks up or down.
Price consolidations followed by a breakout at this point, or a candlestick reversal pattern, provide good confirmation signals and their confluence with the channel serves to strengthen the trader's conviction about upcoming price action.
Once you enter the trade, the next challenge is to exit before the channel reversal blows itself out. You can often clean up with a tidy profit on your risked capital.
If you understand the advantages that can be obtained from using vertical Debit Spreads over single options positions, in combination with this method, you can make excellent consistent profits with minimal risk.
Option Swing Trading - The Trend is Your Friend
The second way is to identify trending price action, using higher-highs and higher-lows in a bullish trend, or the opposite if the trend is bearish. The trader patiently waits for a pullback against the trend, at which point an entry level is planned.
Drawing trendlines under the "lows" if the trend is bullish, or over the "highs" if the trend is bearish, can help identify potential entry points. Trend lines also help you decide whether the trend is weakening or not.
Some prefer to make the peaks and troughs in a trend clearer by including zig-zag lines drawn through closing prices.
If the trend is upward and you have drawn your trend line under the troughs, you should also take note of the peaks. If the angle of the peaks is turning toward the angle of the troughs, the trend may be weakening so you need to be more careful. Same goes for a downward trend, only in reverse.
In short, you need to have some knowledge of stock chart patterns and technical analysis so that you can recognize opportunities and time your entry.
Good trading psychology and self discipline are also essential.
It is far better to patiently wait for just the right entry signal, rather than jumping in because you feel you have to be in a trade. Same goes for your exit - accept a target profit and don't be greedy. "Greedy pigs end up in the bacon factory".
Broadly speaking, you need a signal that indicates whether the stock is in an uptrend or downtrend. A favourite tool for identifying this is moving averages - typically, the 10 and 20 period EMA's for the shorter timeframes, and 50 and 200 period simple moving average (SMA) to mark out the longer term trends.
One of the best trend identifying services I have ever seen is the "Trade Triangle" and market scanning service provided by the people at MarketClub. They offer a 30 day trial for only $1 and provide a wealth of services including their proprietary "trade triangles" (monthly, weekly and daily confluences) as well as market scanning for qualifying trades.
In stock option swing trading, new opportunities are usually identified after the market closes, so that you are prepared for entry within the first half hour of trading after the market opens the next morning. When looking for a reversal signal from a pullback, candlestick charting patterns often provide good signals.
Risk to Reward and Profit Targets
Two important aspects of option swing trading are managing risk and setting profit targets. You can also use trailing stops for profitable trades. Once your first profit target is reached, you sell half your position, leaving the remaining half with a stop loss at break even.
Option Swing Trading presents a number of advantages for the novice trader. It is simple to learn and can be undertaken "without giving up your day job". You can make a significant income without the need for a lot of trading capital, as you would with share trading.
Using Fibonacci Retracements in Swing Trading
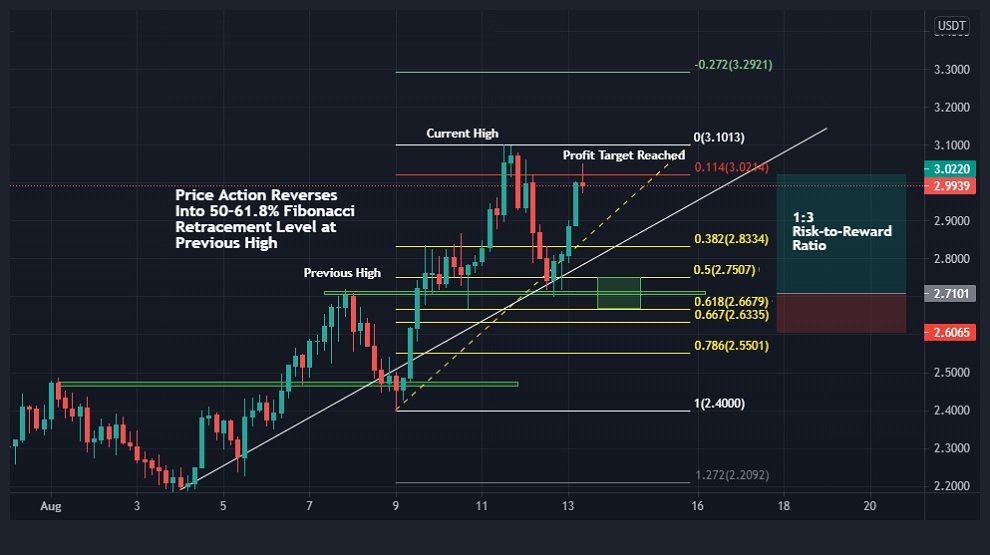
Here's an example of an option swing trading strategy that has an excellent risk to reward ratio. This works just as well for futures or forex trading as it does option swing trading.
- You observe that the trend has recently reversed from bearish to bullish.
- You've noted that it has broken up through the down trending line and formed its first higher-high.
- At this point, you draw a little box from the previous high, across to the right where current price action is.
You then note that this previous high sits at a 50% or 61.8% retracement level to the latest high that is forming.
This confluence of retracement level, together with the previous high, indicates a high probability that price action should bounce off this area and continue upwards in its bullish direction.
So you decide to
- Enter a long position at the 61.8% retracement level and will
- Set your stop loss at the 78.6% fibonacci retracement level.
- But your profit target will be at the 11.4% retracement level, or even the zero retracement level.
An example entry and exit setup is provided in the image below.
An entry at the 61.8% retracement level with profit target at the 11.4% retracement and stop loss at 78.6% retracement will provide the trader with slightly more than a 1:3 risk-to-reward ratio, i.e. risking one amount to make three times as much.
If you have the patience and are prepared to wait for the price to return to the previous high (zero retracement) then your risk-to-reward ratio is even better.
But remember, your original entry was based on a confluence of two signals - the 61.8% retracement coinciding with the previous high.
Traders can play around with these entry, stop loss and profit target levels, depending on what they see the price action telling them.
Stack the odds in your favor - both with confluence entry levels and risk-to-reward ratios. Have patience! Wait for only the best signals, compound your profits so that you can increase your position entry size and one day, you will be wealthy.
10 Simple Rules for Options Swing Trading
1. Choose The Right Brokerage Account
2. Be Aware of External Forces (fundamentals, news)
3. When Swing Trading, Let Time Be On Your Side
4. Never Rely on a Single Stock Indicator
5. Pay Attention to Unusual Volume
6. Price Action Alone is Not Enough!
7. Understand What Volume + Price Together May Indicate
8. Keep a Trade Journal or Use Software to Manage Your Data
9. Start Small and Don’t Try to Become a Millionaire Overnight
10. Be Wary of ANYONE Who Tells You What to Trade if you don't understand their system completely.
************** **************
Return to Option Trading Systems Main Page
Go to Option Trading Home Page



New! Comments
Have your say about what you just read! Leave me a comment in the box below.